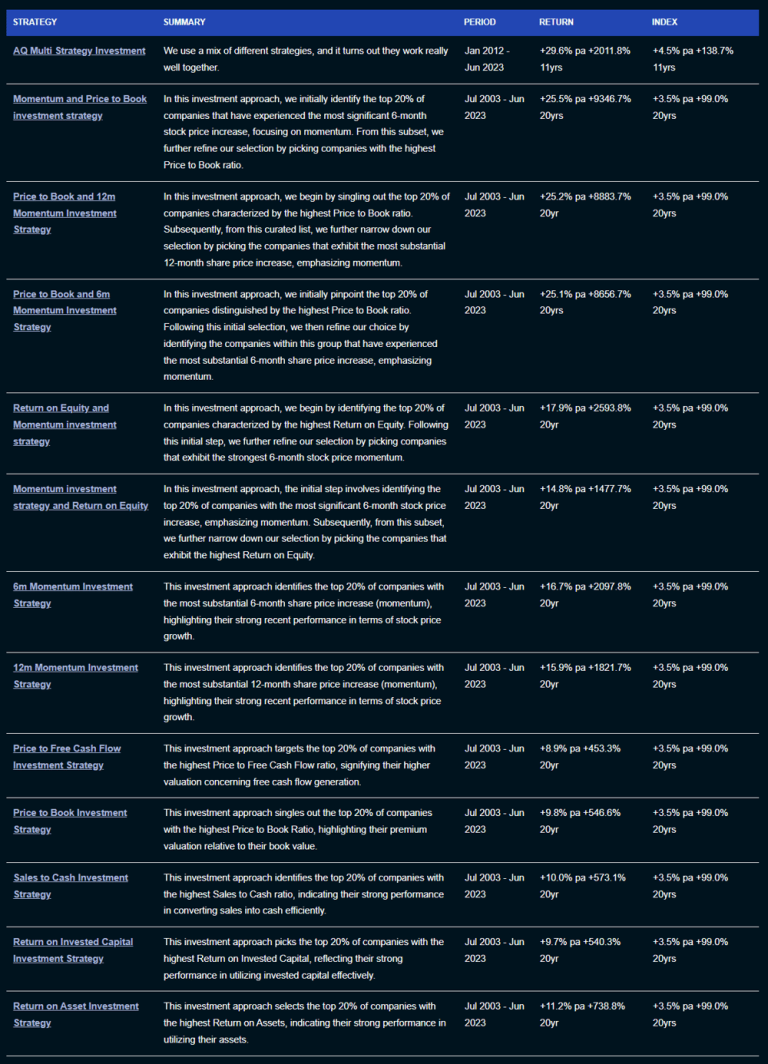
| AQ Multi Strategy Investment |
We use a mix of different strategies, and it turns out they work really well together. |
Jan 2012 - Jun 2023 |
+29.6% pa +2011.8% 11yrs |
+4.5% pa +138.7% 11yrs |
| Momentum and Price to Book investment strategy |
In this investment approach, we initially identify the top 20% of companies that have experienced the most significant 6-month stock price increase, focusing on momentum. From this subset, we further refine our selection by picking companies with the highest Price to Book ratio. |
Jul 2003 - Jun 2023 |
+25.5% pa +9346.7% 20yrs |
+3.5% pa +99.0% 20yrs |
| Price to Book and 12m Momentum Investment Strategy |
In this investment approach, we begin by singling out the top 20% of companies characterized by the highest Price to Book ratio. Subsequently, from this curated list, we further narrow down our selection by picking the companies that exhibit the most substantial 12-month share price increase, emphasizing momentum. |
Jul 2003 - Jun 2023 |
+25.2% pa +8883.7% 20yr |
+3.5% pa +99.0% 20yrs |
| Price to Book and 6m Momentum Investment Strategy |
In this investment approach, we initially pinpoint the top 20% of companies distinguished by the highest Price to Book ratio. Following this initial selection, we then refine our choice by identifying the companies within this group that have experienced the most substantial 6-month share price increase, emphasizing momentum. |
Jul 2003 - Jun 2023 |
+25.1% pa +8656.7% 20yrs |
+3.5% pa +99.0% 20yrs |
| Return on Equity and Momentum investment strategy |
In this investment approach, we begin by identifying the top 20% of companies characterized by the highest Return on Equity. Following this initial step, we further refine our selection by picking companies that exhibit the strongest 6-month stock price momentum. |
Jul 2003 - Jun 2023 |
+17.9% pa +2593.8% 20yr |
+3.5% pa +99.0% 20yrs |
| Momentum investment strategy and Return on Equity |
In this investment approach, the initial step involves identifying the top 20% of companies with the most significant 6-month stock price increase, emphasizing momentum. Subsequently, from this subset, we further narrow down our selection by picking the companies that exhibit the highest Return on Equity. |
Jul 2003 - Jun 2023 |
+14.8% pa +1477.7% 20yr |
+3.5% pa +99.0% 20yrs |
| 6m Momentum Investment Strategy |
This investment approach identifies the top 20% of companies with the most substantial 6-month share price increase (momentum), highlighting their strong recent performance in terms of stock price growth. |
Jul 2003 - Jun 2023 |
+16.7% pa +2097.8% 20yr |
+3.5% pa +99.0% 20yrs |
| 12m Momentum Investment Strategy |
This investment approach identifies the top 20% of companies with the most substantial 12-month share price increase (momentum), highlighting their strong recent performance in terms of stock price growth. |
Jul 2003 - Jun 2023 |
+15.9% pa +1821.7% 20yr |
+3.5% pa +99.0% 20yrs |
| Price to Free Cash Flow Investment Strategy |
This investment approach targets the top 20% of companies with the highest Price to Free Cash Flow ratio, signifying their higher valuation concerning free cash flow generation. |
Jul 2003 - Jun 2023 |
+8.9% pa +453.3% 20yr |
+3.5% pa +99.0% 20yrs |
| Price to Book Investment Strategy |
This investment approach singles out the top 20% of companies with the highest Price to Book Ratio, highlighting their premium valuation relative to their book value. |
Jul 2003 - Jun 2023 |
+9.8% pa +546.6% 20yr |
+3.5% pa +99.0% 20yrs |
| Sales to Cash Investment Strategy |
This investment approach identifies the top 20% of companies with the highest Sales to Cash ratio, indicating their strong performance in converting sales into cash efficiently. |
Jul 2003 - Jun 2023 |
+10.0% pa +573.1% 20yr |
+3.5% pa +99.0% 20yrs |
| Return on Invested Capital Investment Strategy |
This investment approach picks the top 20% of companies with the highest Return on Invested Capital, reflecting their strong performance in utilizing invested capital effectively. |
Jul 2003 - Jun 2023 |
+9.7% pa +540.3% 20yr |
+3.5% pa +99.0% 20yrs |
| Return on Asset Investment Strategy |
This investment approach selects the top 20% of companies with the highest Return on Assets, indicating their strong performance in utilizing their assets. |
Jul 2003 - Jun 2023 |
+11.2% pa +738.8% 20yr |
+3.5% pa +99.0% 20yrs |


